Dieser Beitrag wurde am 18.11.2015 um 22:38:18 in Cloudy Migration Life veröffentlicht
ADFS – How to enable Trace Debugging and advanced access logging
Debugging an Active Directory Federation Services 3.0 farm together with the Web Application Proxy servers in front can be a very complex task when you think of all the different constellations that can be served by this technology. Especially when it comes to access from mobile devices and Microsoft Online as relying Party.
In principle, trace debugging can have 3 target scopes:
- Trace debugging on the backend – on WAP servers and ADFS servers to see how the authentication request is terminated
- Trace debugging on the accessing device – to see how the authentication request is initiated
- Network trace to see the authentication flow travels from device to the ADFS farm and back. Actually you need to terminate the SSL connection with a special tool like Fiddler to inspect the content.
For many professionals the Fiddler trace will be the most complex way to start debugging, especially when you are acting in secured and controlled enterprise network. Many apps on mobile devices (e.g. the Office Apps for Android) also show poor logging and tracing capabilities to show what the app is actually doing in terms of federated authentication.
Therefore, we should utilize the complete debugging capabilities of ADFS as preferred option. As long as there is a communication between device and WAP/ADFS servers, we fortunately receive a lot of information from the Trace logs of the backend servers.
STEP 1: Set Trace level and enable ADFS Tracing log:
Please enable the debugging logging on the ADFS 3.0 Server:
Open an elevated CMD window and type the following command: C:Windowssystem32>wevtutil sl “AD FS Tracing/Debug” /L:5
In Event Viewer highlight “Application and Services Logs”, right-click and select “View – Show Analytics and Debug Logs”

In Event Viewer highlight “Application and Services Logs”, right-click and select “View – Show Analytics and Debug Logs”
Navigate to AD FS Tracing – Debug, right-click and select “Enable Log” to start Trace Debugging immediately.
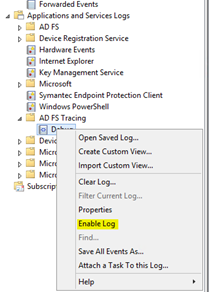
Navigate to AD FS Tracing – Debug, right-click and select “Disable Log” to stop Trace Debugging.
It is difficult to scroll and search in the events page by page in the Debug Log. Therefore save all Debug events into an *.evtx file first.

Open the saved log again. Now you can scroll and search a lot smoother through the events.

STEP 2: Enable Object access auditing to see access data in security logs:
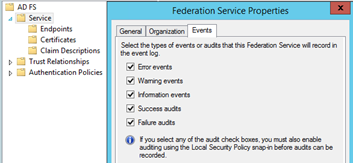
If we want to see exhausting data about access activities on the ADFS servers we have to tun on object access auditing (not account logon auditing). You have to enable auditing in 2 locations on the ADFS server.
- Turn on auditing in the ADFS GUI. On the primary ADFS server right-click on Service and activate “Success audits” and “Failure audits”. This setting is valid for all ADFS servers in the farm.
- To make this setting actually work, you have to do a second step on the ADFS server in the Local Security Policy (unless there is a similar Group Policy setting coming from the Active Directory structure).
Open the GPO Editor, navigate Computer ConfigurationWindows SettingsSecurity SettingsLocal PoliciesAudit Policy and configure “Audit Object Access” with “Success” and “Failure”. This setting has to be made in the Local Security Policy on each ADFS server (or a GPO is set on OU or different level in Active Directory).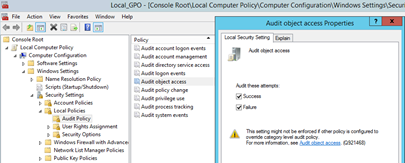
- Looking at the security event logs of the ADFS servers, you will notice a much higher amount of events coming in which provide a much higher level of insights.
It is a good starting point to exactly note the time when running e.g. an access attempt and then look up the timestamps (+ offset for runtime) in both event logs, ADFS Trace Debugging and Security.